[Blockchain A to Z] Entering the World of Cryptocurrency (Part 2)
By The VOB Foundation
Cryptocurrencies differ widely in function and structure, operating across layered blockchain architectures such as Layer 1 foundations and Layer 2 scaling solutions, rather than existing as a single, uniform type of asset. Charts, especially candlesticks, reflect not just price movements but the collective psychology of market participants, making successful trading a matter of interpreting human behavior and timing, not numbers alone.
Lecture 3: Cryptocurrencies May Look Similar, but Their Functions Differ
When people hear “cryptocurrency,” they often think only of Bitcoin. In reality, however, there are thousands of
cryptocurrencies, and their functions, roles, and technical foundations vary widely. They share the common trait of
being digital assets, but some are designed primarily for payments and transfers, others for providing technical
infrastructure, and still others to be used only within a specific ecosystem. To understand these differences, you
first need to recognize that cryptocurrencies operate across multiple structures and layers—not as a single,
one-size-fits-all “coin.”
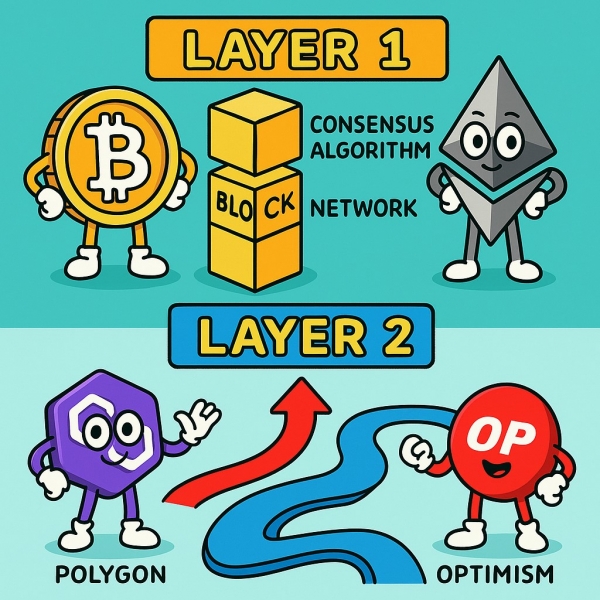
The Concept of “Layers” in Blockchain Architecture
One of the first concepts you should understand is the idea of “layers,” a way to categorize blockchain technical
architecture into Layer 1 and Layer 2. Layer 1 refers to an independent main blockchain. Layer 2, by contrast, is an
auxiliary system built to complement or extend Layer 1, focusing on improving transaction speed and reducing fees.
Looking at cryptocurrencies through this layer framework makes it easier to see what role each one plays in its
ecosystem.
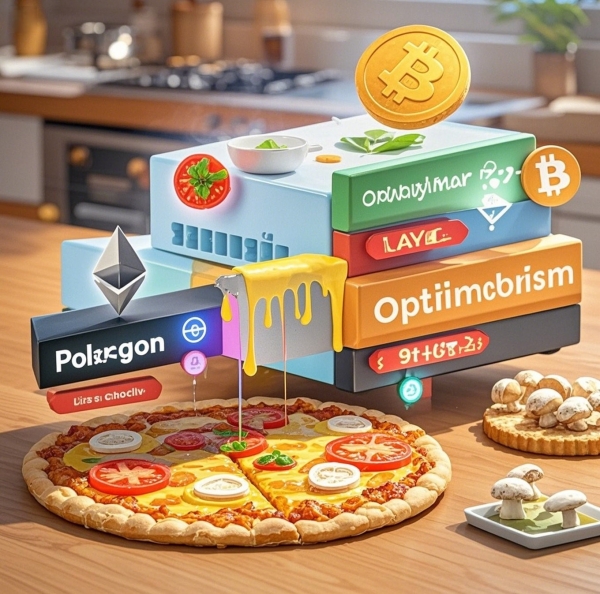
Understanding Blockchain Layers with a Pizza Analogy
Blockchain is not a single technology—it is a structure where multiple layers work together. To make this easier,
think of a pizza. Just as dough, sauce, cheese, and toppings combine to create a complete pizza, a blockchain works
by placing various functions (Layer 2) on top of a foundational base (Layer 1).
Layer 1 is like the pizza dough: it is the foundation that supports everything. It is an independent blockchain
network—such as Bitcoin or Ethereum—that creates blocks and validates transactions. This base is strong in security
and reliability, but it can face limitations in speed and scalability.
Layer 2 is like the sauce, cheese, and toppings: additional features placed on top of the base. Just as toppings
enhance a pizza’s flavor and versatility, Layer 2 boosts blockchain throughput and efficiency. Layer 2 helps speed up
transactions, lower fees, and often expands functionality by enabling features such as NFTs and decentralized apps
(dApps).
In short, blockchain is not a single-layer technology but an integrated system where a base network and extension
layers operate together. Understanding how these layers complement each other is key to understanding the broader
blockchain ecosystem.
Layer 1 vs Layer 2
Layer 1 is the core foundation of a blockchain: an independent network that verifies and records transactions on its
own. Its strengths are security, trustworthiness, and decentralization, but as usage grows it can suffer from
scalability limits such as slower processing and higher fees.
Layer 2 emerged to address these limits. It runs on top of Layer 1 and processes transactions separately to improve
speed and efficiency. Layer 2 is advantageous for reducing fees and expanding capabilities (such as NFTs and dApps),
but because it depends on Layer 1, it can face certain constraints in security and stability.
The two layers perform different roles, but together they form a complementary structure that supports the growth of
the blockchain ecosystem.
Conclusion (Lecture 3)
The development of cryptocurrencies began as a search for better scalability, leading to two approaches: Layer 1 and
Layer 2. This evolution is still ongoing, and blockchain systems continue to advance. We hope this lecture helps you
understand the differences between these layers and the scalability solutions each provides.
Lecture 4: Chart Basics—The First Step to Reading Price Flow
Because cryptocurrencies are digital assets without a tangible “real-world” form, charts often become the primary—if
not the only—information window, rather than news or financial statements. Learning to read charts is closely tied to
interpreting market psychology. This section covers the most basic building block: candlesticks, and the psychology
embedded in them.
What Bullish and Bearish Candles Mean
The most basic unit on a chart is the candlestick. A bullish candle means the price rose; a bearish candle means the
price fell. More precisely, if the closing price is higher than the opening price, it is bullish; if the close is
lower than the open, it is bearish. Each candle contains four data points—open, close, high, and low—and the “candle
chart” visualizes these values through color and shape.
The Time Compressed Inside a Single Candle
A candle is not just a line; it is a compressed record of a day or a specific time window. For example, a 1-minute
candle shows price flow over one minute, while a 1-hour candle contains the open/high/low/close over one hour. That
means the same “bullish candle” can carry very different meaning depending on the timeframe. Reading charts requires
understanding timeframe and context—not just color.
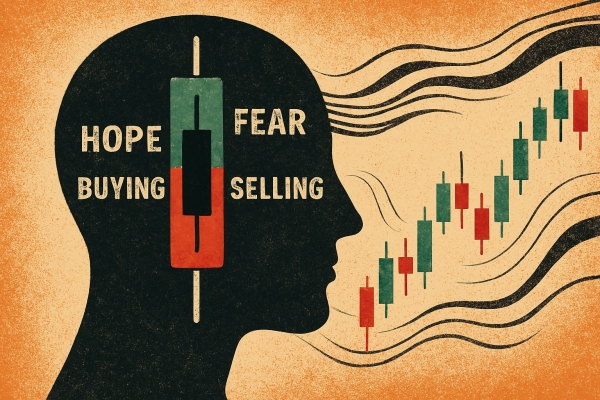
The Psychology of Buying and Selling
A chart is not merely price movement—it is the trace of psychology. A stretch of bullish candles typically indicates
buying pressure dominated; a stretch of bearish candles indicates selling pressure dominated. When volume
concentrates in a zone or a sudden reversal occurs, you should consider the possibility that large capital (“whales”)
influenced the move. Retail investors (“ants”) often follow behind or get shaken by these moves.
Ultimately, reading charts is like reading a psychological battle beyond the numbers.
Conclusion (Candlesticks)
Candlesticks are not just visual tools. They are compressed records of buying and selling, hope and fear, speed and
hesitation. Even a single candle contains the judgments and emotions of countless traders. Reading charts means
interpreting and responding to this complex flow.
From here, your understanding should expand beyond “it went up” or “it went down” to include timeframe, psychology,
and the balance of power between different market participants.
You Can See the Chart—So Why Is Profit Still Hard?
The crypto market is open to everyone, yet only a small minority consistently profits. Even though everyone sees the
same chart, outcomes differ dramatically. Charts may look like simple lines and numbers, but inside them are the
psychology of participants—misjudgment, fear, and greed all tangled together.
Avoid the Falling Knife… Yet the Place You Avoid Becomes the Bottom
Common retail psychology repeats. People know the advice “don’t catch a falling knife,” yet during sharp drops many
enter thinking “this must be the bottom,” only to face deeper declines without a rebound.
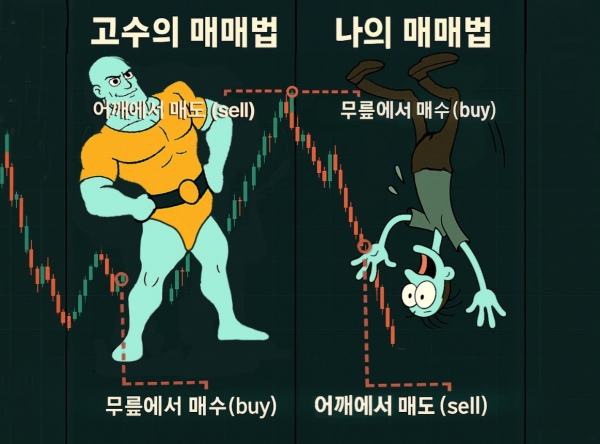
Buy at the Knees, Sell at the Shoulders?
Another saying is “buy at the knees and sell at the shoulders,” but markets are always explained in hindsight. What
you thought was the knee may have been the thigh, and what you believed was the shoulder may have been the top. A
chart records outcomes; it does not provide “the answer.” What matters is timing, and timing is shaped by psychology
and conviction. Even an “objective” chart can look completely different depending on the viewer’s mindset.
The Majority’s Decision Doesn’t Automatically Mean the Opposite Is Right
You may hear “do the opposite of retail investors,” but if you get the timing wrong, you can end up in the paradox
where you’re the only one wrong while everyone else seems to profit. If you follow the crowd, you can also end up
buying at the most expensive point during an overheated move.
Final Conclusion
Charts are open to everyone, but if you don’t understand the psychological structure and the subtle timing gaps, the
chart can create illusions rather than clarity. Beyond technical analysis, remember that reading a chart is, in many
ways, interpreting human psychology.