[Blockchain A to Z] Scam Prevention & Advanced Chart Analysis
By The VOB Foundation
This post explains how common cryptocurrency scams work and how to protect yourself by questioning “guaranteed returns,” verifying official sources, and never approving suspicious wallet requests or sharing seed phrases. It uses the 2022 Luna/Terra collapse as a major lesson about the danger of blindly trusting “safe” systems without understanding their risk mechanisms.
The cryptocurrency market offers innovative opportunities, but it is also a space where many risks and scam tactics coexist.
In this session, we look at real-world cases to identify typical patterns and types of crypto-related scams, and review practical standards to help prevent
investor losses and victimization.
The Luna Collapse: The Breakdown of a System Everyone Trusted
In 2022, the collapse of Luna (LUNA) and Terra (UST) was recorded as one of the most shocking events in the history of the crypto market.
Under the name “stablecoin,” countless investors entrusted their funds, believing in its stability. For a period, the system maintained its price successfully
and earned market confidence. But the moment Terra’s value began to shake, Luna attempted to “support” it through a dangerous mechanism: effectively unlimited
issuance. As a result, the value of both coins collapsed almost instantly. Prices plunged by more than 99%, and market-cap losses were estimated at over
60 trillion KRW, causing enormous damage to many retail investors. What was described as a “safe algorithm that guarantees $1” ultimately became the device
that brought the market down.
This was not merely a price crash. It was the cost of excessive trust in technical structure, the psychology of investors who assumed “blockchain-based” meant
trustworthy, and the failure to understand risk mechanisms before chasing returns. The Luna incident had such a wide impact domestically and globally that it
even inspired a film, and it will remain an unforgettable event in the crypto market for years to come.
Types and Characteristics of Cryptocurrency Scams
Crypto scams are not simple deception—they are structural actions designed to exploit investors’ expectations and lack of information.
These scams are not problems you can avoid just by being “careful.” You need prior understanding and concrete response strategies for each scam type.
1) “Guaranteed daily profits” investment scams
The first type is “guaranteed-return” investment solicitation. Phrases like “Earn 3% a day—90% a month!” can tempt anyone.
But there is no such easy money. Scammers often pay early returns to build trust, then later freeze funds through withdrawal limits, account suspensions, and
similar tactics. Many operate in a multi-level structure, using a Ponzi scheme in which new investors’ funds are used to pay earlier investors.
To prevent this, immediately be suspicious of phrases like “high return,” “no risk,” and “guaranteed.”
You should verify whether the service is registered with financial authorities and whether it is officially recognized by credible institutions or exchanges.
Also note that investing via overseas platforms often makes recovery nearly impossible.
2) “Free coin” airdrop scams
Airdrops are a common marketing tool in crypto: projects distribute free tokens to attract new users.
The problem is the rise of “impersonation airdrop scams.” Scammers copy the name, images, and description of real airdrop events, create fake websites, and
spread links via social media, messengers, email, and even Google ads.
When users click the link believing it is official, scammers ask them to connect a wallet, complete KYC, or follow “signup” steps, then steal personal data,
seed phrases, or wallet approvals/permissions. To avoid this, never click links outside official channels (official website, Discord, X/Twitter, etc.).
Always verify the URL, and when wallets like MetaMask show an “approval request,” read the details carefully before confirming.
Even if it looks like an “official event,” a small difference can cost you everything.
3) Fake projects pretending to be “the next big coin”
The third type is “fake projects and rug pulls,” often seen in NFTs, new tokens, and DeFi projects.
NFTs are digital assets whose ownership can be proven using blockchain technology, even though they aren’t “physical” like a drawing or game item.
Scam projects exploit this by claiming “a rare NFT is launching soon” or “you’ll be too late if you don’t join now,” pulling investors in through aggressive marketing.
Many such projects create hype very quickly and cultivate an overheated community atmosphere while providing unclear or insufficient information.
If the developers/operators are not transparent, or if the community is filled with uncritical praise and no room for independent criticism, those are potential red flags.
Before investing, you must check fundamental project information, whether the team’s identity is publicly disclosed, and whether honest discussion is possible within the community.
Education for Prevention: Doubt and Verification Are the Best Shield
Crypto scams can stem from a lack of technical understanding, but sometimes excessive confidence causes even greater damage.
Even investors with a certain level of knowledge and experience can ignore warning signs because they believe “this time will be fine.”
The crypto market still has regulatory blind spots, and each project’s structure and purpose can vary widely.
Instead of trusting something simply because it is recommended or popular, start with basic questions:
Who operates this project? How is the profit model designed? Where does my money go?
Without a habit of verifying for yourself, it is easy to become a victim of scams that evolve faster than technology itself.
Before making an investment decision, conduct sufficient research and keep your expected returns realistic.
Ultimately, the most practical way to protect yourself is not technology first, but the attitude of questioning and learning.
Conclusion
Blockchain is often described as a system that “implements trust through technology.”
Yet that trust structure can also become an ideal stage for scammers.
While blockchain provides integrity against record tampering, it also has another face:
with a single approval or a single mistake, your entire assets can disappear.
Technical security does not automatically mean user protection.
“Decentralization” also means responsibility is distributed.
To prevent damage, you need user-centered security awareness:
be cautious of unfamiliar messages and double-check every transaction and approval before proceeding.
Lecture 6: Advanced Charting — Understanding Technical Patterns and Trends
Price charts are not just a list of numbers. They are a visual result that concentrates the psychology of countless buyers and sellers and the traces they leave behind.
Within these flows, there are certain rules and repetitions, and the technique of analyzing them is called “chart pattern analysis.”
Similar patterns have consistently been found not only in traditional financial markets but also in the crypto market.
Markets Repeat: Reading the Flow
Peaks formed during an uptrend, rebound attempts within a downtrend, and directional breakouts after energy accumulation appear repeatedly and draw investors’ attention.
These repetitions are not random: because human psychology often reacts in similar ways, markets—being a collective of psychology—tend to form repeatable structures.
Perfect prediction is impossible, but understanding patterns that recur with a certain probability can reduce risk and strengthen decision-making.
Understanding Trends: The First Step to Reading the Market
Many beginners have heard “charts go up and down,” but they don’t clearly understand what a “trend” is or why it matters.
This lecture explains the concept of market trend and how to recognize an uptrend, downtrend, and sideways trend on real charts.
What is a trend?
Reading a chart ultimately means understanding where price is moving. A trend is the flow of price moving in a certain direction.
In the short term, price can fluctuate, but if it maintains a similar direction over a period of time, it is considered a trend.
“Follow the trend” is not just advice—it’s the starting point of trading: understand the market’s direction first.
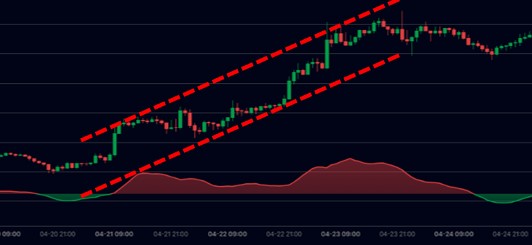
Uptrend
An uptrend is when price gradually rises. Trading happens at higher levels over time, and more participants feel that “it might go up.”
In such phases, many people want to buy on dips, so you often see pullbacks followed by renewed upward movement.
This is commonly called a bull market, where optimistic market outlook dominates and retail participation tends to increase.
Chart source: Rising X
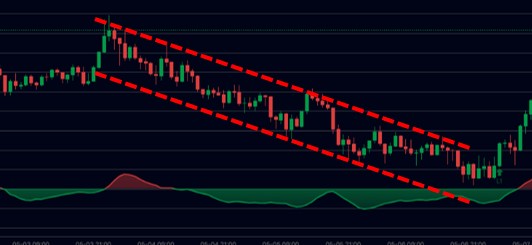
Downtrend
A downtrend is a flow where price gradually falls. Trading continues at lower levels, and participants think “it could drop further.”
Even when price bounces briefly, it often falls again, and investors focus more on limiting losses than on recovery.
This is generally called a bear market, dominated by fear and uncertainty. Expectations for rebounds are weak, and rebounds themselves may trigger stronger selling.
Chart source: Rising X
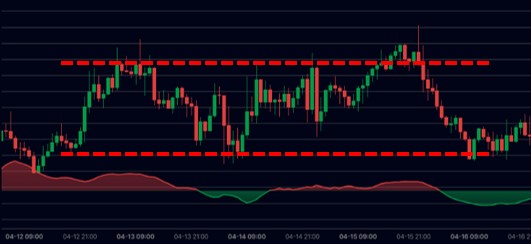
Sideways trend
A sideways trend refers to repeated fluctuations within a fixed price range—neither rising nor falling decisively.
Because it stays within a band, direction is unclear. This phase can be seen as a standoff where buying and selling forces are similar.
It is often called a range market, where market fatigue accumulates, reactions to news weaken, volume decreases, and directionless repetition continues.
Chart source: Rising X
Trend interpretation: the start of trading strategy
Markets always move. If you can read the flow first, your next decision becomes much easier.
Your criteria for buying and selling changes depending on the trend:
in bull markets, many treat pullbacks as opportunities; in bear markets, some treat rebounds as opportunities to sell.
When there is no clear direction, waiting or using shorter-term strategies may be more appropriate.
Even complex charts can be categorized into these three flows. Understanding trends is the first step in learning how to “talk” to the market.
In the next stage, we will discuss a structure where market energy compresses and then bursts in a direction—focusing on the “triangle consolidation” pattern.
What is “triangle consolidation”?
If you have ever paid attention to charts, you may have heard phrases like:
“We’re seeing an ascending triangle,” “It’s converging diagonally,” or “Waiting for a triangle breakout.”
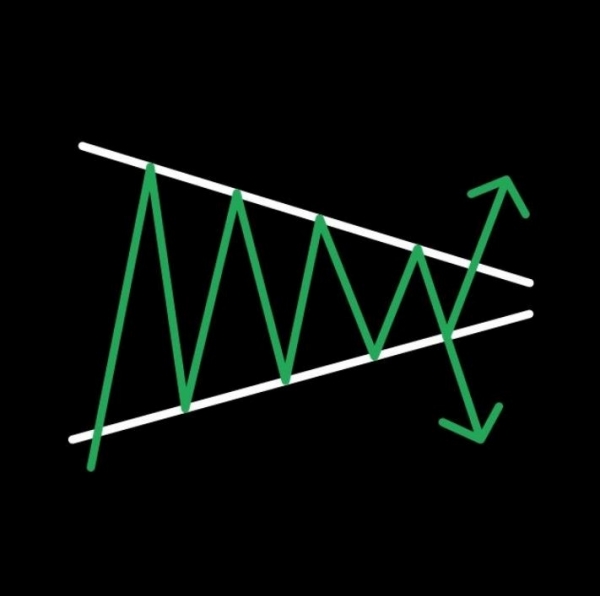
In chart analysis, “consolidation” refers to a phenomenon where the range narrows as highs and lows move closer together.
Prices converge toward a single point—hence the term “converge.” Because the shape resembles a triangle, it is called a “triangle consolidation pattern.”
Image source: priceactiontrades
Put simply: price starts with large swings, the swings gradually shrink, and the movement heads toward a single apex.
This zone reflects a period where market participants hesitate and “test” each other. In many cases, when the consolidation ends, a strong move erupts in one direction.
That’s why analysts often view it as a signal that “a direction is about to appear.”
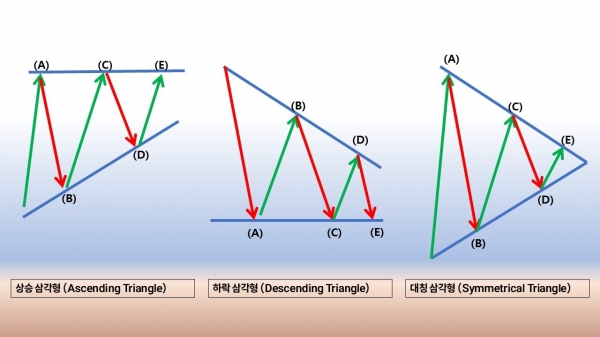
After consolidation: how directions diverge
After price converges, the market ultimately moves in one direction.
Depending on whether it breaks upward, breaks downward, or stays stagnant, different patterns emerge.
Beginners sometimes misunderstand “consolidation = bullish,” but consolidation is only a balance of forces.
The direction becomes clear only after the breakout.
Therefore, you should not interpret patterns by “shape” alone.
Consider both: the current trend and what patterns can appear within that context.
Even learning the three basic pattern categories can begin to develop your ability to read market flow.
That is the true starting point of chart analysis.
Patterns gain power only when connected to strategy
Triangle consolidation is one of the most common patterns for beginners—and also one of the easiest to misread.
Many assume “consolidation means it will go up,” but consolidation itself is merely a balance of forces; the direction is only confirmed after the breakout.
Therefore, consolidation zones are better treated as “preparation time,” not “entry time.”
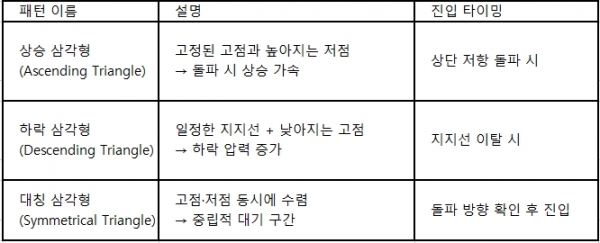
For example, in an ascending triangle, increasing buying pressure may be inferred, and traders often wait for resistance to break before entering a breakout strategy.
In a symmetrical triangle, either direction is possible, so it is common to combine alerts and volume checks and prepare flexible entry plans based on breakout direction.
Conclusion
Chart patterns are not just lines and curves. They are traces of countless trades and structures shaped by market psychology.
Repeating patterns can suggest direction, but they are not enough by themselves.
What matters is how you read the pattern and connect it to execution.
Theory is only a starting point; in real markets, variables always exist.
You need a perspective that considers volume, timing, and strategy together rather than interpreting patterns in isolation.
In the next installment, we will introduce reversal patterns that signal a direction change and continuation patterns that sustain the existing direction.
With the fundamental flow understood, we can build more refined market interpretation through deeper structures.