[Blockchain A to Z] Trading Fundamentals & Advanced Chart Analysis
By The VOB Foundation
The post explains how crypto markets work, who trades in them (retail “ants” vs large “whales”), and how exchanges match buyers and sellers to form prices through the order book. It then compares spot vs futures trading (including long/short and leverage risk) and market vs limit orders, and introduces centralized (CEX) vs decentralized (DEX) exchanges with their pros and cons.
Introduction — Understanding the Cryptocurrency Financial Market
A financial market is a large marketplace where people buy and sell money or assets.
Stocks, currencies, commodities, indices, and cryptocurrencies are all traded in this space.
Some participants invest with a long-term outlook, while others pursue short-term profits through rapid trading.
Prices are formed where buyers and sellers meet.
The cryptocurrency market works the same way.
People trade coins such as Bitcoin and Ethereum and experience gains or losses.
These movements are not just numbers—they reflect the judgments and emotions of many participants.
Who Trades in the Market?
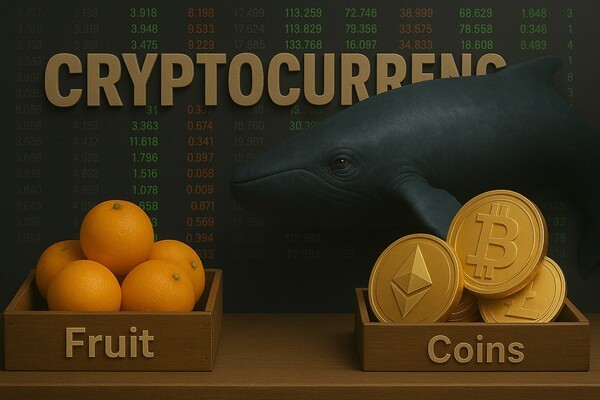
The main participants can be broadly divided into two groups: “ants” and “whales.”
This common expression in financial markets is used to distinguish investors by scale and behavior.
“Ant” investors typically refer to retail investors who operate with smaller amounts.
They may be relatively vulnerable to information gaps or make decisions based on emotion.
When prices surge, they often buy late; when prices drop sharply, they may sell in fear even at a loss.
In contrast, “whales” refer to large players—institutions or high-net-worth investors—who can influence market flow.
By moving huge positions at once, whales can significantly shift price direction.
In markets dominated by ants, emotion often leads.
In markets dominated by whales, strategy tends to drive moves.
You can think of the market direction as being shaped by the tug-of-war between these two forces.
What Is an Exchange (Market)?
Think of buying and selling coins on an exchange like shopping at a digital fruit store.
Just as you buy oranges or apples at a market, you can buy cryptocurrencies like Bitcoin or Ethereum on an exchange.
If one orange costs 1,000 KRW and you want 100 oranges, you need 1,000 × 100 = 100,000 KRW.
It’s the same with crypto: if you want to buy 1 Bitcoin and the price is 14,000,000 KRW, you need that amount
(in KRW or a stablecoin, depending on the exchange).
Beginners sometimes misunderstand exchanges as simple “shopping malls.”
In reality, an exchange is powered by a matching engine that compares buy and sell conditions and executes trades automatically.
An exchange is not just a broker platform—it is a real-time automated trading system.
Do You Have to Buy a Whole Coin?
If an orange is too expensive, you can buy half or one-fifth.
Bitcoin is similar: it can be divided into tiny units, so you can buy fractions such as 0.1, 0.01, or 0.0001 BTC.
Even if you can’t afford one full coin, you can still buy a small portion.
That’s fractional trading.
Bitcoin’s smallest unit is the “satoshi.”
1 BTC equals 100,000,000 satoshis (100,000,000 sat).
This structure enables even small investors to participate in the market with very small amounts.
How Is the Price Determined?
In a grocery store, each item has a fixed price tag.
On an exchange, prices are determined by supply and demand—what buyers want to pay and what sellers want to receive.
When those prices match, a trade is executed (filled).
This pricing mechanism is called the order-book (bid/ask) system.
A buyer’s offered price is a bid, and a seller’s offered price is an ask.
The meeting point of bids and asks forms the market price.
In trading, watching how bids and asks change is the first step to reading market psychology.
Spot Trading vs. Futures Trading
For beginners, “spot” and “futures” can feel unfamiliar.
But entering the market without understanding the difference is like launching a boat without knowing the direction of the sea.
Spot trading is the most intuitive form: buy at a lower price, sell at a higher price.
You actually purchase and own the asset.
For example, if Bitcoin is 10,000,000 KRW and you buy 1 BTC, you truly own that Bitcoin.
If the price rises you can realize profit; if it falls you take a loss.
Because it is tied to ownership, the risk is generally lower than leveraged derivatives.
Futures trading is different: you trade a contract based on predicting the future price direction.
You do not need to purchase Bitcoin itself.
Instead, you open a position based on whether you think the price will rise (long) or fall (short).
Example: if Bitcoin is 10,000,000 KRW and you expect it to rise to 11,000,000 KRW, you open a long position.
If it actually rises, you profit from the difference.
If you expect the price to fall, you can open a short position—similar to selling first and buying back later at a lower price.
If Bitcoin falls from 10,000,000 KRW to 9,000,000 KRW after you short, you profit from that decline.
Futures trading makes it possible to profit in both rising and falling markets.
However, it often includes leverage, which can amplify both gains and losses.
Because you can control a large position with a small amount of capital, losses can grow quickly if your prediction is wrong.
Many beginners are tempted by leverage and enter futures too early, only to suffer major losses.
We will cover leverage risk management in more detail in a later lecture.
In short: spot trading is buying and selling the actual asset, while futures trading is a contract bet on price direction.
Exchanges typically separate spot and futures markets, and beginners are generally advised to start with spot first.
Market Order vs. Limit Order
Exchanges offer multiple ways to place orders.
A market order means “buy/sell immediately,” executing at the best available market price.
A limit order means “execute only at my chosen price.”
Example: you place an order to buy when the price reaches 980, and it fills automatically if the market reaches that price.
Market orders are fast but may fill at a worse price.
Limit orders can get a better price but may never fill.
In real trading, choosing the right order type based on market conditions is an important strategic decision.
Types of Exchanges — CEX vs. DEX
Crypto exchanges are broadly divided into centralized exchanges (CEX) and decentralized exchanges (DEX).
Centralized Exchange (CEX)
Most well-known exchanges—such as Upbit, Binance, and Coinbase—are centralized exchanges.
A company operates the platform, and users deposit assets into the exchange to trade.
Pros: Fast execution, user-friendly UI, convenient deposits/withdrawals, and customer support.
Cons: If the exchange is hacked, user assets may be at risk; withdrawal restrictions and policy risks can exist.
Decentralized Exchange (DEX)
Platforms such as Uniswap and dYdX are decentralized exchanges.
Users connect their wallets and trade directly without an intermediary.
Pros: You control assets in your own wallet; stronger resistance to censorship; more autonomy.
Cons: Harder to use, potentially slower, and fees (gas) can be high depending on the network.
CEX platforms are generally easier for beginners, but as you gain experience, learning to use DEX platforms is also valuable.
In decentralized environments, you control your assets—but that also means responsibility is yours.
If you send funds to the wrong address, you usually cannot reverse it.
Conclusion
The crypto market is not just a place to buy and sell—it is a complex arena where people, emotions, and strategies collide.
Different participants shape market direction, and the battle between opposing forces creates trends.
Exchanges are the stage where these movements are executed, supported by sophisticated systems under the hood.
Order types like market and limit orders are not just “how to buy,” but tools that affect flexibility, efficiency,
and execution strategy. In practice, traders often combine both depending on market conditions.
For example, right after a high-volatility news event, a market order may help you enter quickly.
In a range-bound market or near a technical level (such as support), a limit order may provide a more precise entry.
Spot trading is the basic approach to profit from rising prices by owning the asset.
Futures trading can generate profits even in down markets, but it comes with significantly higher risk.
Many beginners think trading is simply “buy when it goes up, sell when it goes down.”
But trading is the accumulation of strategy—interpreting market movement and acting according to your own rules.
Understanding these fundamentals is the necessary foundation for any strategy you build later.
Lecture 8: Understanding Chart Patterns by Trend (Trend-Based Pattern Analysis)
In the previous session, we learned how to distinguish bull markets, bear markets, and sideways markets,
and we explored triangle consolidation as a representative pattern showing how market energy compresses.
In this session, we will extend that learning by studying reversal patterns (trend changes) and continuation patterns (trend maintenance),
so we can distinguish the moments when the market turns and the zones where it keeps moving in the same direction.
Reversal Patterns (Trend-Change Patterns)
Reversal patterns indicate signals that the existing trend may bend or reverse.
They appear when an uptrend stops and turns downward, or when a downtrend ends and begins to rebound upward.
Because these patterns visualize turning points, they are useful tools even for beginners.
Let’s look at six representative reversal patterns.
Patterns Signaling a Reversal from Uptrend to Downtrend
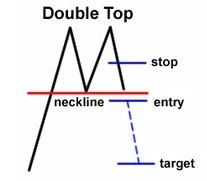
1) Double Top
Shaped like the letter “M.” It forms when price creates two peaks and fails to break higher.
This is often interpreted as a signal that a decline may begin.
How to use: If price breaks below the trough (support) between the two peaks, the likelihood of a down move increases.
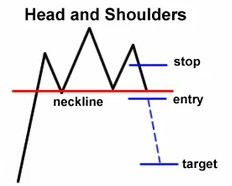
2) Head and Shoulders
A three-peak structure where the middle peak (the “head”) is the highest.
It forms in the sequence left shoulder → head → right shoulder.
If price turns down at the right shoulder, it may signal the end of the uptrend and a shift to decline.
How to use: If price breaks below the neckline (the line connecting the lows between head and shoulders),
you can consider a sell-biased approach. If price rebounds above the head level, it is safer to apply a stop-loss rule.
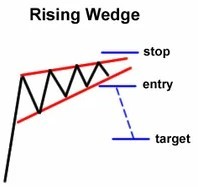
3) Rising Wedge
Price rises gradually while the range narrows.
It may look bullish at first, but momentum often weakens and the pattern tends to break downward.
It can be viewed as a bearish signal appearing during an uptrend.
How to use: If price breaks below the lower trend line (support), it can be treated as the start of a decline
and considered as a timing point for sell entry.
Patterns Signaling a Reversal from Downtrend to Uptrend
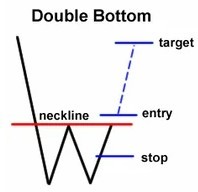
1) Double Bottom
Shaped like the letter “W.” It forms when price tests the bottom twice and then rises.
It is often interpreted as a signal that downside pressure is weakening.
How to use: If price breaks above the peak between the two bottoms, a rebound is more likely to start.
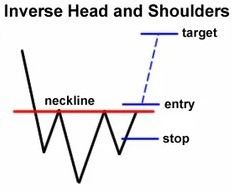
2) Inverse Head and Shoulders
The opposite structure of the head and shoulders pattern.
It forms three valleys where the middle valley (the “head”) is the lowest.
If price rebounds from the right valley, it can be seen as a signal of an uptrend reversal.
How to use: If price breaks above the neckline, you can consider a buy-biased approach.
If price falls again below the prior low, apply a stop-loss rule.
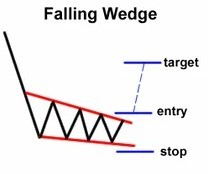
3) Falling Wedge
Price declines gradually while the range narrows.
This suggests that the downtrend is weakening and price may eventually break upward.
It is a bullish signal that appears during a downtrend.
How to use: If price breaks above the upper trend line (resistance), the probability of an uptrend reversal increases,
and it can be considered a point to plan a buy entry.
Even though markets appear to rise or fall, they often pause and move sideways within a range.
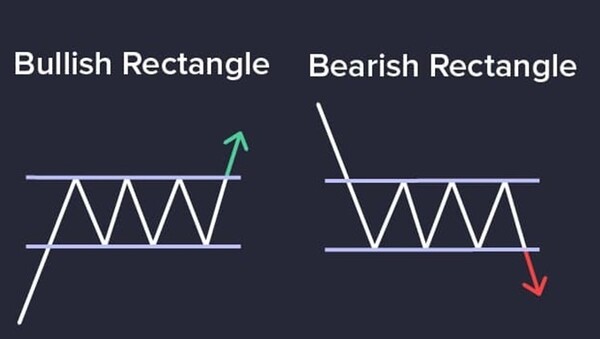
When price is “boxed in” and fluctuates within a band, it is called a rectangle pattern.
Depending on the broader trend context, it can be classified as a bullish rectangle or a bearish rectangle.
1) Bullish Rectangle
During an uptrend, price pauses and starts oscillating within a range.
Overall strength may still favor the upside, and this zone can be interpreted as a “breather” before continuation.
How to use: If price breaks strongly above the upper boundary (resistance), the uptrend may resume.
This breakout point can become a potential buy-entry timing.
The longer the range lasts, the larger the post-breakout move can be.
2) Bearish Rectangle
During a downtrend, price pauses and moves within a range.
Although price fluctuates inside the box, the primary flow still leans bearish.
This can be seen as a temporary pause in selling pressure before continuation.
How to use: If price breaks below the lower boundary (support), the downtrend may continue.
This can be a zone to consider short (sell) entries.
If the breakdown occurs with increasing volume, the likelihood of a stronger decline increases.
Three Core Indicators in Technical Analysis
Technical analysis is a tool for forecasting market behavior based on price and volume movement.
In crypto—where fundamentals can be less directly tied to price action—technical indicators often play an even larger role.
This section introduces three core pillars of technical analysis: trend, momentum, and volatility,
explaining how each works and how to interpret them in practice.
Before you begin trading seriously, you need to understand why price moves and where it may be headed.
Technical indicators are tools used for that purpose.
Among countless indicators, the most basic three categories are trend, momentum, and volatility.
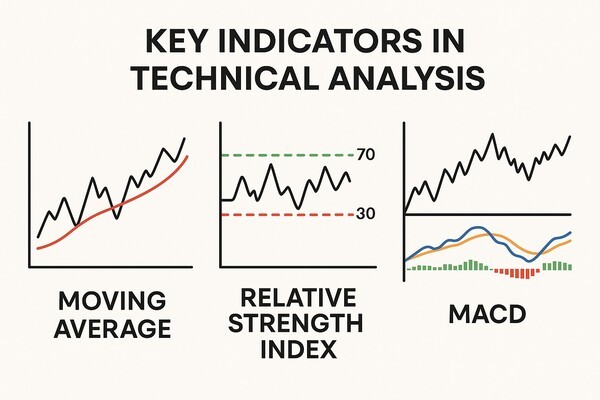
1) Trend Indicators
Trend indicators help you determine whether the market is rising, falling, or moving sideways.
Moving Average (MA): A line connecting the average price over a set period, smoothing price action to show trend direction.
MACD (Moving Average Convergence and Divergence): Uses the gap between short- and long-term moving averages
to detect potential trend changes. Crossovers between the MACD line and the signal line can become buy/sell timing signals.
How to use: If moving averages slope upward and the MACD line crosses above the signal line,
it may be interpreted as an uptrend entry signal. If MACD crosses downward, watch for a potential shift to a downtrend.
2) Momentum Indicators
Momentum measures how fast price is moving and is often used to judge overheated conditions.
RSI (Relative Strength Index): A 0–100 scale. Above 70 is often interpreted as overbought; below 30 as oversold.
Stochastic Oscillator: Shows where the current price sits relative to a recent range. Useful for capturing quicker swings.
How to use: Traders may consider buying when RSI rises after dropping below 30,
and selling when RSI turns down after exceeding 70.
Stochastic crossovers between %K and %D lines are also commonly used signals.
3) Volatility Indicators
Volatility indicators show how widely price is swinging, helping you assess market tension and breakout risk.
Bollinger Bands: Bands plotted above and below a moving average, outlining a “normal” price range.
Moving outside the bands can indicate overheated conditions.
VIX (Volatility Index): An index representing overall market instability, sometimes called the “fear index.”
How to use: A break above the upper Bollinger Band can indicate strong bullish momentum,
but it can also precede a pullback—so context matters.
A squeeze (band contraction) followed by expansion can signal the start of a sharp move.
Conclusion
Technical indicators act like a compass that simplifies market movement.
Trend indicators show the big direction, momentum indicators show the strength of movement,
and volatility indicators show the degree of risk.
These three pillars complement each other, and they are most powerful when combined.
For example, if the market shows an uptrend while RSI is overbought, you might consider the possibility of a short-term pullback,
then check volatility tools (such as Bollinger Bands) to see whether price is truly pushing beyond its typical distribution.
Ultimately, the goal of technical analysis is not perfect prediction, but identifying zones with a probabilistic edge.
Rather than blindly trusting indicators, it is important to learn how to read them together with market structure.
Understanding these three categories correctly is the first step.
You are now standing at the doorway of real trading.
In the next session, we will go deeper into risk management and trading strategy.